Agilent Improved Detection from Sample Concentration Manual
Contents
1. that the repeatability for 34 successive analyses ranges from 1 0 to 1 9 with a sampling time of 7 seconds It was also noted that the use of a shorter sampling time 5 seconds resulted in RSD values 1 2 3 6 that were slightly lower but with slightly higher sample enrichment As with most methods the analyst must strike a balance between the desired detection levels and required level of performance Another important factor in application method optimization is to determine the capacity of the adsorption material To assess this the 1 pom sample was drawn through the adsorption tube for varying times at a fixed pumping rate 450 mL min desorbed at a fixed heating value time onto the 490 GC and peak areas measured Figure 6 Peak Area vs Sample amount e Benzene Toluene Ethylbenzene 0 Xylene e Propylbenzene Butylbenzene Peak Area 0 200 400 600 800 1000 1200 1400 1600 1800 2000 Sample amount mL Figure 6 Sampling linearity and breakthrough As can be seen from Figure 6 the breakthrough volume varies considerably and ranges from benzene at 700 mL to 1400 mL or greater for toluene Enrichmen and Desorption Un and 490 GC Micro With Sample Concentration Without Sample Concentration Peak Identification 1 Benzene 2 Tolene 3 Ethyloenzene 4 p and m Xylene 5 o Xylene 6 Propylbenzene 7 Butyl2. Improved Detection from Sample Concentration O M Enrichment and Desorption Unit Sample Concentrator with the 490 GC Micro GC Advantage Statement Sample detection limits can be Sampling Phase markedly improved if analytes are concentrated before they The sample is pumped from its container Tedlar bag are injected into the Varian 490 GC Micro GC Using the through a heated sample line onto the adsorption tube Enrichment and Desorption Unit EDU Sample Concentrator the sample is adsorbed onto a porous medium These Desorption Phase trapped analytes are then desorbed and transferred to the The adsorption tube is heated in stop flow Micro GC for separation and analysis Using this approach enrichment can be increased by more than 230 times Injection Phase The adsorption tube is set in back flush mode and the Introduction desorbed sample components flow through a heated In general the typical detection limit of the 490 GC is transfer line to the Micro GC 1 10 ppm and is compound dependent Detection limits can be improved by concentrating the sample prior to Materials and Reagents introduction to the Micro GC by the method outlined above BTEX Gas Sample Containing balance nitrogen Benzene 1 42 ppm Instrumentation Toluene 1 46 ppm Ethyloenzene 1 59 ppm o xXylene 1 63 ppm m Xylene 1 53 ppm p Xylene 1 72 ppm Propyloenzene 1 38 ppm i Butyloenzene 2 35 ppm Butyloenzene 2 79 ppm Conditions 490 GC Micro GC Figur
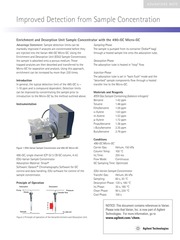
3. e 1 EDU Varian Sample Concentrator and 490 GC Micro GC Carrier Gas Helium 150 kPa Column Temp 100 C 490 GC single channel CP Sil 5 CB GC column 4 m Inj Time 255 ms EDU Varian Sample Concentrator Flow Mode Continuous Adsorption Material Tenax GC Sampling Time Optimized Software Galaxie Chromatography Software for GC control and data handling EDU software for control of the EDU Varian Sample Concentrator sample concentrator Transfer Gas Helium 85 kPa Sampling 60s 30 C Principle of Operation Desorption Phase 120 s 180 C Adsorption Desorption Inj Phase 30 s 180 C i rs p Pressure Clean Phase 005 220 C Transfer flow Cool Phase 100 s H F NOTICE This document contains references to Varian Saat T M Please note that Varian Inc IS NOW part of Agilent es a Technologies For more information go to Figure 2 Principle of operation of the VarianEnrichment and Desorption Unit www agilent com chem gE Agilent Technologies Enricnmen Results and Discussion Using the conditions listed above the chromatogram in Figure 3 was obtained Peak Identification 1 1 Benzene 4 2 Toluene 3 Ethyloenzene 4 p and m Xylene 2 5 o Xylene 6 Propylbenzene 7 Butyloenzene 8 Butylbenzene 8 0 1 2 3 Min 4 Figure 3 BIEX analysis using the Varian sample concentrator and 490 GC For each application the system requires some method optimization particularly the transpo
4. hout sample concentration to 5 ppb with sample concentration for several aromatic compounds For benzene the enrichment factor approximately 150 was the lowest because this component was sampled beyond the breakthrough volume of the trap With these settings enrichment factors from 150 to 230 were reached RSDs of peak area were below 2 indicating that the system stability and repeatability was quite good The EDU Varian Sample Concentrator and 490 GC Micro GC provide an excellent solution for achieving much lower detection limits when conducting fast GC analysis Chromatography Spectroscopy Mass Spectrometry Magnetic Resonance Spectroscopy and Imaging X Ray Crystallography Dissolution e Consumables Data Systems Vacuum Galaxie Varian the Varian Logo and the Varian Care Logo are trademarks or registered trademarks of Varian Inc in the U S and other countries 2009 Varian Inc SI 02238 A 10 09 Printed in UK
5. oenzene 8 n Butylbenzene 0 1 2 Figure 7 Enrichment Details To determine the enrichment factors the chromatogram results produced from the 1 ppm sample after direct injection were compared with the results generated using analysis with sample concentration 1800 mL total flow The results have been overlayed in Figure 7 The actual sample enrichment factor varied component to component as illustrated in Tables 1 and 2 Table 1 Enrichment factors Benzene Toluene Ethylbenzene Propylbenzene Butylbenzene With EDU 23 05 43 90 42 60 39 05 32 00 Without EDU Enrichment Factor Table 2 Summary results I Benzene _ Toluene Ethylbenzene Propylbenzene n Butylbenzene RSD ppm Approx Det Lim ppb Varian Inc www varianinc com North America 800 926 3000 925 939 2400 Europe The Netherlands 31 118 67 1000 Asia Pacific Australia 613 9560 7133 Latin America Brazil 55 11 3238 0400 Other sales offices and dealers throughout the world check our Web site 3 Min 4 Conclusions The experimental data clearly show that routine detection levels can be significantly improved when the 490 GC Micro GC is used with sample concentration provided by the Varian Enrichment and Desorption Unit prior to analysis Enrichment factors as much as 230 x or more can be obtained depending on the sample component and chromatographic conditions In this case the detection limit was improved from 1 ppm wit
6. rt delay of sample from EDU Varian to the 490 GC Micro GC and the adsorption trap material and capacity Toluene ANS o0 Xylene e Propylbenzene Jj i Butylbenzene I n Butylbenzene Peak Area 0 2 4 6 8 10 12 14 Sampling time sec Figure 4 Sample transport through the transfer line Figure 4 shows the measured peak area for selected components as a function of the GC sampling time Note that prior to a sampling time of 4 seconds no component peak areas were measurable by the 490 GC After a sampling time of 4 to 5 seconds an increase could be seen in the amount of component peak area measured However at 7 seconds and beyond the individual peak area values flatten out considerably which adds to the robustness of the method The desorption of the components from the adsorption tube is in back flush mode The concentration of the components in the desorption profile is dependant on the volatility boiling point of the component and its affinity for the adsorption material and Desorotion Unit and 490 Micro Benzene e a eee Toluene Ethylbenzene Peak Area gt m p Xylene 0 Xylene e Propylbenzene j Butylbenzene n Butylbenzene 0 5 10 15 20 25 30 35 Injection Number Figure 5 Repeatability results over 34 successive injections Figure 5 shows
Download Pdf Manuals

Related Search
Agilent Improved Detection from Sample Concentration Manual